

The Process
Secondary Research
First, we conducted a literature review of research papers on related topics including: annual water reports, communicating water quality emergencies, communicating data creatively, and using analogies to enhance data comprehension.
Our insights helped us identify current gaps in the market, define proven practices for communicating water quality data, and understand key concepts behind successful safety communication and data visualization.
We also conducted a competitive analysis on 10+ apps and websites to further understand the interaction between water quality data (or similar data) and people.

Primary Research
Next, we conducted semi-structured interviews with 10 river users, including swimmers, paddlers, and boaters. We reached a diverse group of users, including older adults and immunocompromised individuals.
Our goal of these interviews was to better understand their motivations, wants, needs, and pain points relating to their safety and health while participating in water activities. We also wanted to gauge their interest and general knowledge of water quality parameters, as well as understand their overall relationship with water quality.

Define
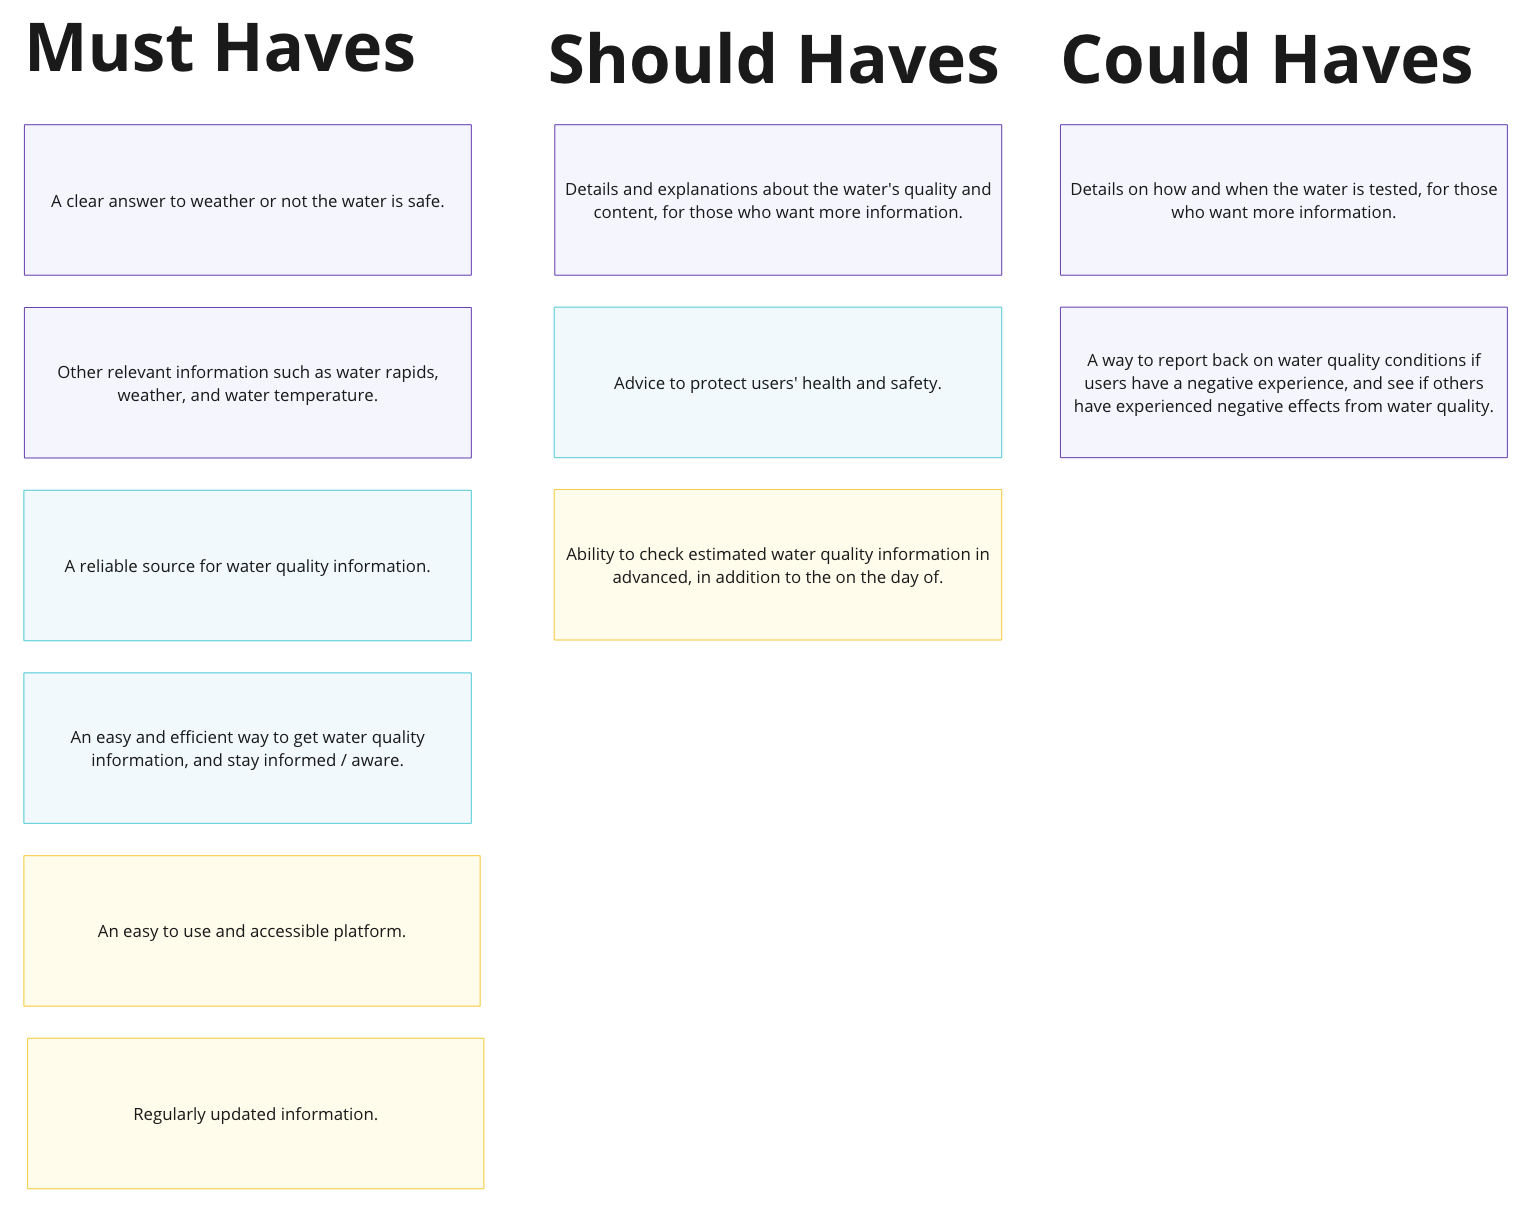
Our findings showed that river users needed a clear answer to weather or not the water is safe that they could quickly access and easily interpret. Wanting to access this information themselves was a common theme amongst participants, many of whom mentioned paint points related to having to rely on others, such as coaches or event coordinators, for this crucial information.
In addition to accessible and understandable water quality data, we learned that lack of awareness about water quality (compared to air quality, or UV index for example) was widely lacking. This prompted us to question how we might help keep river users informed, and distill unfamiliar water quality parameters.
One participant expressed his feelings after being sick from poor water quality at a swimming event: "I just wanted a way to report it... also to know if anyone else got sick." This unique finding drove our decision to include a community forum in our solution, so river users could report water poor quality conditions and read reports from other users in their area.
Focusing on these findings, we defined our goals with the MoSCoW method.
Iterate
Using our research, we designed our first prototype in Figma.
If I had the chance to do this project again, I would have advocated for an extension on our MVP deadline. Rushing to get this initial prototype completed caused us to skip past ideation and iteration, which resulted in a prototype that lacked thoughtful information architecture, and overall visual appeal.
Test
With our first prototype completed, we conducted 8 usability tests with river users including swimmers and paddlers.
From these usability tests we discovered that while our communication of water quality data was quick and easy to interpret, the app's navigation and organization was difficult to follow.
.png)
Iterate
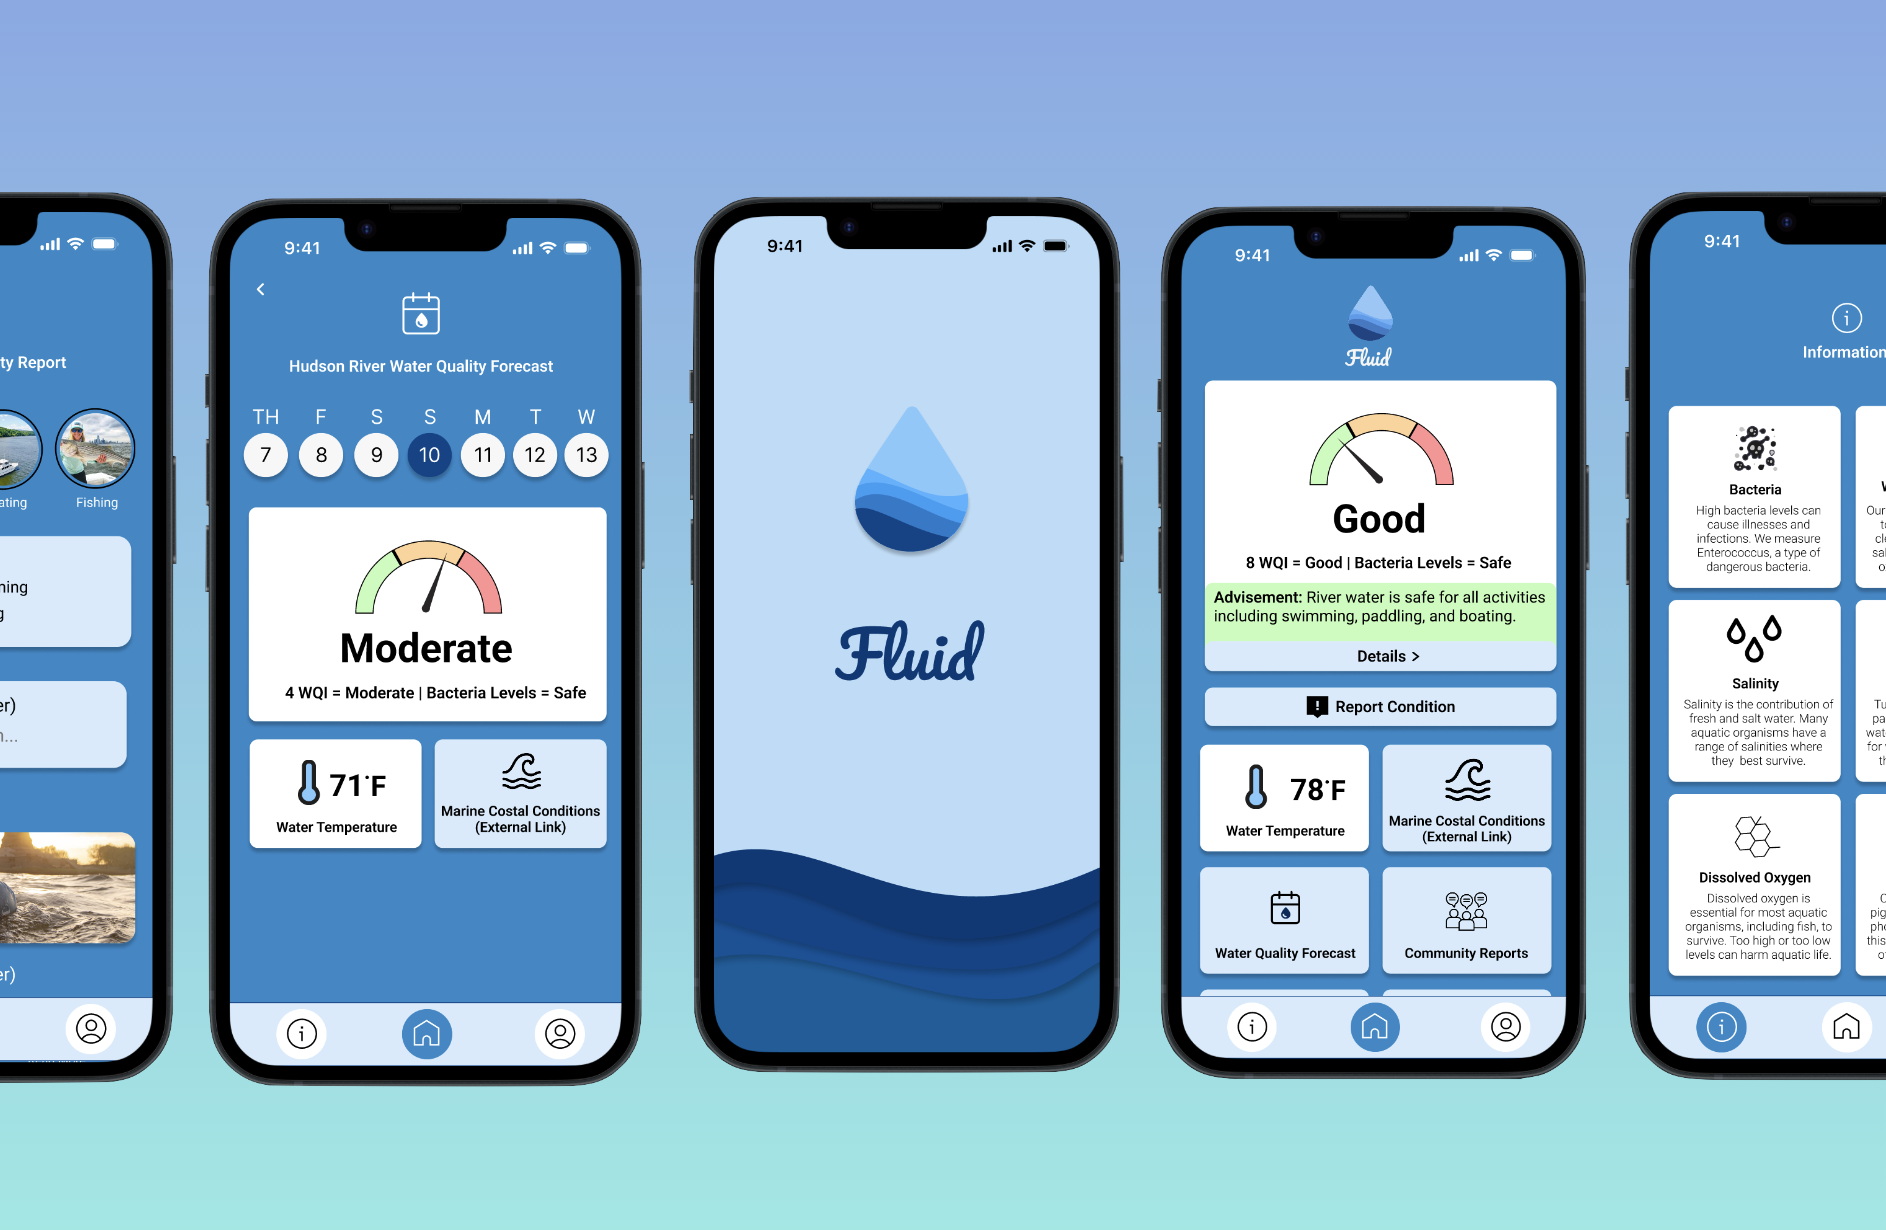
We iterated on our design to improve navigation and usability issues, and utilized visual design principles to create a more delightful interface.
